Reading the Inclusion Plot on a Diamond Report
Open a diamond grading report and you will find, usually on the second page, a diagram of the stone covered in tiny colored symbols. That is the inclusion plot, and it is one of the most useful yet most overlooked parts of the certificate. The plot maps where the diamond's internal characteristics, its inclusions and blemishes, are located inside the stone. Where the clarity grade tells you how included the diamond is, the plot tells you where those inclusions actually sit. That information matters, because an inclusion near the edge can be hidden by a prong, while one in the center of the table is far more noticeable. This guide explains how to read the inclusion plot, what the symbols mean, and how to use it to judge a diamond you are considering.
If you have ever stared at the little map on a grading report and wondered what to do with it, this is the practical, plain-language explanation.
What the Inclusion Plot Shows
The plot is a top-down and, sometimes, side representation of the diamond, marking each internal characteristic with a standardized symbol. The symbols show the type of inclusion: clouds, crystals, feathers, needles, and so on, plus external blemishes like scratches or nicks. By mapping them, the lab gives you a picture of where the diamond's internal features live. This is not decorative; it is a guide to how visible the inclusions will actually be. Our clarity guide explains the grading scale that the plot illustrates. A diamond with a single plot point near the girdle looks very different, in reality, from one with several plotted features in the center.
The plot also helps you compare two diamonds of the same clarity grade. Two stones both graded SI may look quite different: one has a single, edge-hidden crystal, while the other has several central features. The clarity grade averages this out, but the plot reveals the difference. This is why two "SI1" diamonds can differ dramatically in appearance and value. The plot is the detail that the single grade does not capture. Buyers who learn to read it can prefer a clean SI stone over a messier VS stone, and get a better deal. The plot turns the clarity grade from a label into a map.
What the Symbols Mean
Labs use a legend to identify the plotted symbols, though you do not need to memorize every shape. In general, small dots, lines, and shaded areas represent different internal features: a small crystal inclusion, a feather (a small internal fracture), a cloud (a hazy area), or a needle. The exact symbol matters less than the location and size it marks. When you look at the plot, ask two questions: where are the features, and how many are there? A single tiny mark near the girdle is far less concerning than multiple marks clustered under the table. The plot is read like a treasure map: location is everything. Our GIA report guide shows the legend alongside the plot.
It is worth understanding that plotted features are part of the diamond's natural growth, not damage. A "feather" sounds alarming but is usually a tiny internal feature that is perfectly stable, not a crack about to spread. The plot simply records these characteristics as the lab sees them. Reading the plot should reduce anxiety, not increase it: you are seeing exactly what the diamond contains, with no surprises. A well-understood inclusion, located near an edge where a setting will hide it, can be completely invisible to the naked eye. The plot helps you find those diamonds. Our certificate versus appraisal guide explains how the plot's documented features support the stone's identity.
Using the Plot to Judge Visibility
The practical value of the plot is predicting whether inclusions will be visible in the mounted ring. Inclusions near the girdle, under the crown edges, or behind prongs can be effectively hidden by the setting, so a diamond that looks included on the plot may look eye-clean once mounted. Conversely, an inclusion plotted dead-center under the table is hard to hide, and it is worth inspecting directly. This is why the plot helps you choose a stone that will look clean in its final setting. Ask the jeweler where the prongs will sit relative to the plotted features, and you can often "hide" an inclusion by mounting strategically. That is a real, practical benefit of reading the plot. Our cut guide explains how the table and crown relate to visibility.
The plot also helps you avoid surprises. If a diamond is eye-clean under the loupe but the plot shows a cloud across the center, you know why it may look slightly hazy. If the plot shows a single edge crystal, you can be confident it will not be visible. When you compare diamonds, use the plot as a secondary check on the clarity grade: a high grade with an unfavorable central plot is less attractive than a slightly lower grade with edge-hidden features. The plot rewards this kind of reasoning, because it shows you the real distribution rather than an average score. This is how you find diamonds that look cleaner than their grade suggests.
The Plot and the Laser Inscription
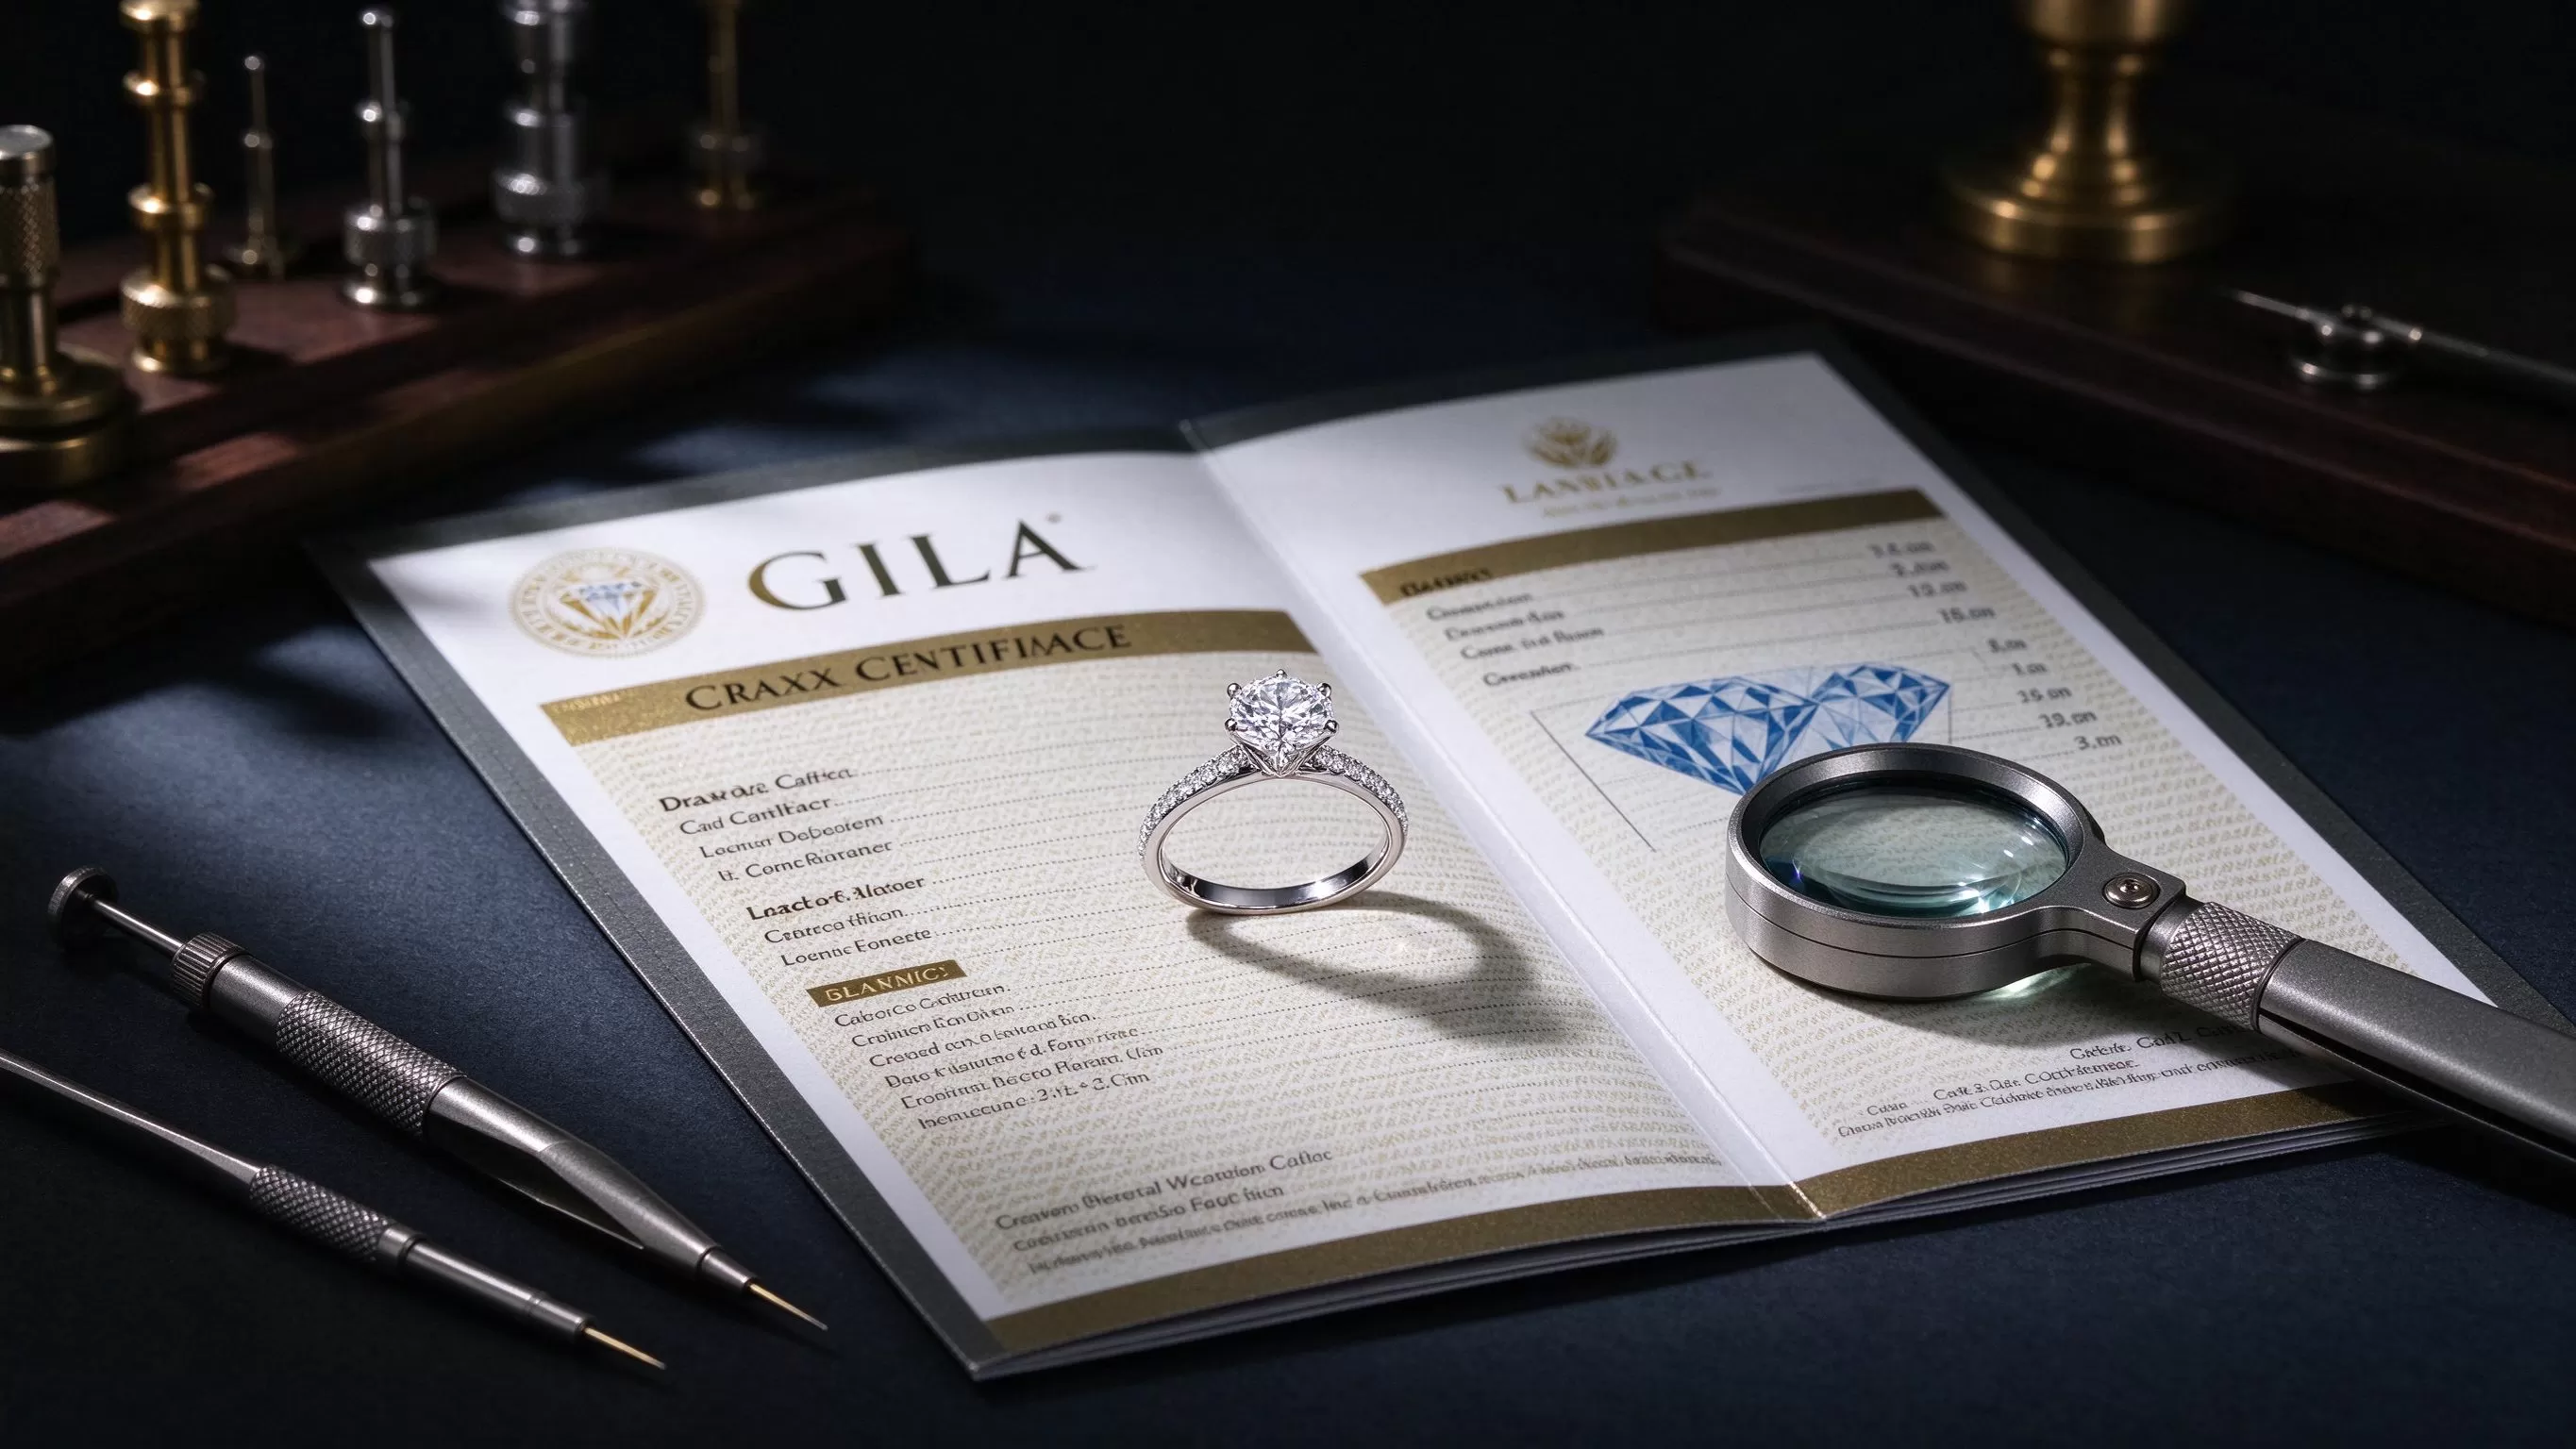
Modern reports often include a laser inscription on the diamond's girdle that matches the report number, and the plot on the report corresponds exactly to that stone. When you verify a diamond, you compare the inscribed number to the report, and the plotted features confirm you are looking at the same stone. Our guide to girdle inscription verification explains this matching. The plot is part of that identity: two diamonds with the same clarity grade but different plots are, clearly, different stones. Keeping the report with the stone means the plot remains your reference. If you ever resell or insure the diamond, the plot and the report together establish exactly what the stone is. This is one more reason the plot is a functional, not cosmetic, part of the certificate.
When a diamond is sold without its report, the plot becomes impossible to verify, which is why buying a graded stone with its original report is strongly preferred. The plot is the lab's map of that specific diamond; without it, the clarity grade is just a number. Always buy a diamond that comes with its full report, and keep that report safe. If the diamond is ever re-graded, the new plot will reflect any changes, but the original report preserves the stone's documented history. Treat the inclusion plot as the diamond's fingerprint, because in a real sense, it is.
Common Plot Features and What They Mean
A few inclusion types appear again and again on plots, and knowing them removes the alarm. A crystal is a small mineral inclusion inside the diamond, tiny and usually harmless; many diamonds contain them. A feather is a small internal fracture-like line, not a crack about to break, and it is stable unless it reaches the surface. A cloud is a cluster of tiny pinpoints that can make an area look slightly hazy, and it is the feature most worth watching because it affects overall brilliance. A needle is a thin, thread-like inclusion. Our clarity guide lists these in more detail. The point is that none of these is a defect that threatens the diamond; they are the natural fingerprints of how the crystal grew. The plot simply records them, and their location, not their existence, is what you should care about.
External blemishes also appear on the plot, like a small polish mark or a nick on the girdle. These are surface features, not internal ones, and they are often less concerning than internal inclusions because a surface mark can sometimes be polished away. When the plot shows an external blemish near the girdle, a good jeweler may be able to address it lightly. Internal features cannot be removed without recutting. This distinction matters when you weigh a stone: a diamond with a few surface blemishes is often preferable to one with deep central internal inclusions, even if the clarity grade looks similar. Reading the plot helps you see which kind you are looking at, and that changes how worried you should be.
The Plot Across Different Labs
Because labs grade clarity slightly differently, the plot and the clarity grade can differ between laboratories. One lab may grade a stone VS2 while another calls it SI1, because tolerances vary. The plot itself, however, remains the physical map of that specific diamond, and comparing the plots of two reports on the same stone is reassuring: the features should correspond. Our guide to GIA versus IGI versus NGTC explains how grading strictness differs. This is one reason to prefer a respected lab: its clarity grades and plots are trusted in the market, which protects resale value. A diamond plotted and graded by a recognized lab carries that credibility wherever it goes.
When buying, treat the plot as a complement to the clarity grade, not a replacement. The grade tells you the market-accepted classification; the plot tells you the specific arrangement. Combined, they give a far fuller picture than either alone. A buyer who understands both can look past the grade and assess the actual stone, which is exactly how you find a diamond that looks cleaner than its price suggests. The plot is the lab's most honest gift to the informed buyer: it shows you everything, and lets you decide what matters. That transparency is what makes graded diamonds such a safe purchase, as long as you know how to read the map.
Frequently Asked Questions
What is the inclusion plot on a diamond report? It is a diagram of the diamond mapping where its internal inclusions and blemishes are located, using standardized symbols. It shows not just how included the stone is, but where the features sit, which determines how visible they will be.
Do I need to memorize all the plot symbols? No. The exact symbol matters less than the location and number of marked features. Look at where the features are clustered: near the girdle or under the center of the table. The legend on the report identifies them if you need specifics.
Can a plotted inclusion be hidden by the setting? Yes. Inclusions near the girdle, under the crown edges, or behind prongs can be effectively hidden once the ring is mounted. A diamond with an edge-hidden inclusion can look eye-clean in its setting even with a modest clarity grade.
Why are two diamonds with the same clarity grade so different? The clarity grade is an average, while the plot shows the distribution. One SI1 may have a single edge crystal; another may have several central features. The plot reveals the difference that the grade averages out.
Is a plotted inclusion a defect or damage? No. Internal features like feathers and crystals are natural growth characteristics of the diamond, not cracks or damage. The plot documents them so you know exactly what the stone contains, with no surprises.
Read the Map, Not Just the Grade
The inclusion plot turns a single clarity number into a picture you can actually use. It shows where the diamond's natural features sit, which determines how visible they will be once the ring is mounted. By reading the plot, you can prefer a cleanly mapped lower-clarity stone over a messier higher-clarity one, hiding edge features behind prongs and avoiding central inclusions. It also confirms the diamond's identity alongside the laser inscription. Buyers who read the plot buy more intelligently, because they judge the actual stone rather than the label. We help clients interpret the inclusion plots on grading reports, so they understand exactly what they are buying. If you want help reading the plot on a diamond you are considering, write to service@holycome.com, and explore more in our Certification Explained library.